Short answer: A P&L shows each line on its own. The FIXE Financial Deep Dive, a monthly review of your numbers, shows how the lines connect and what to do about them. In one sample review, it caught operating profit sliding to near breakeven, food sales falling faster than food purchases, a beverage spike that was really timing, labor creep, prime cost over 60%, discount leakage, and cash that rose only because the owners put money in. Then it turned all seven into a 30-day action plan.
By the FIXE team. November 2026.
Key takeaways
- A P&L tells you what happened. A review tells you which lines matter and what to do next.
- In the sample, operating income fell from $22,350 to $4,440 in one month.
- Prime cost went from 58.6% to 65.1%, and every point was worth $1,754 a month.
- Not every spike is a problem. The beverage jump was likely a wine order that landed Sep 28.
- Every finding ends in a 30-day plan with a priority, an action and a threshold.
Meet the sample: Restaurant A
Restaurant A (sample) is a one-location neighborhood bistro that opened in April 2024. Below is what its September 2026 Financial Review, prepared by FIXE in October 2026, caught compared to August.
Sample restaurant and numbers, made up for illustration.
1. Operating profit sliding to near breakeven
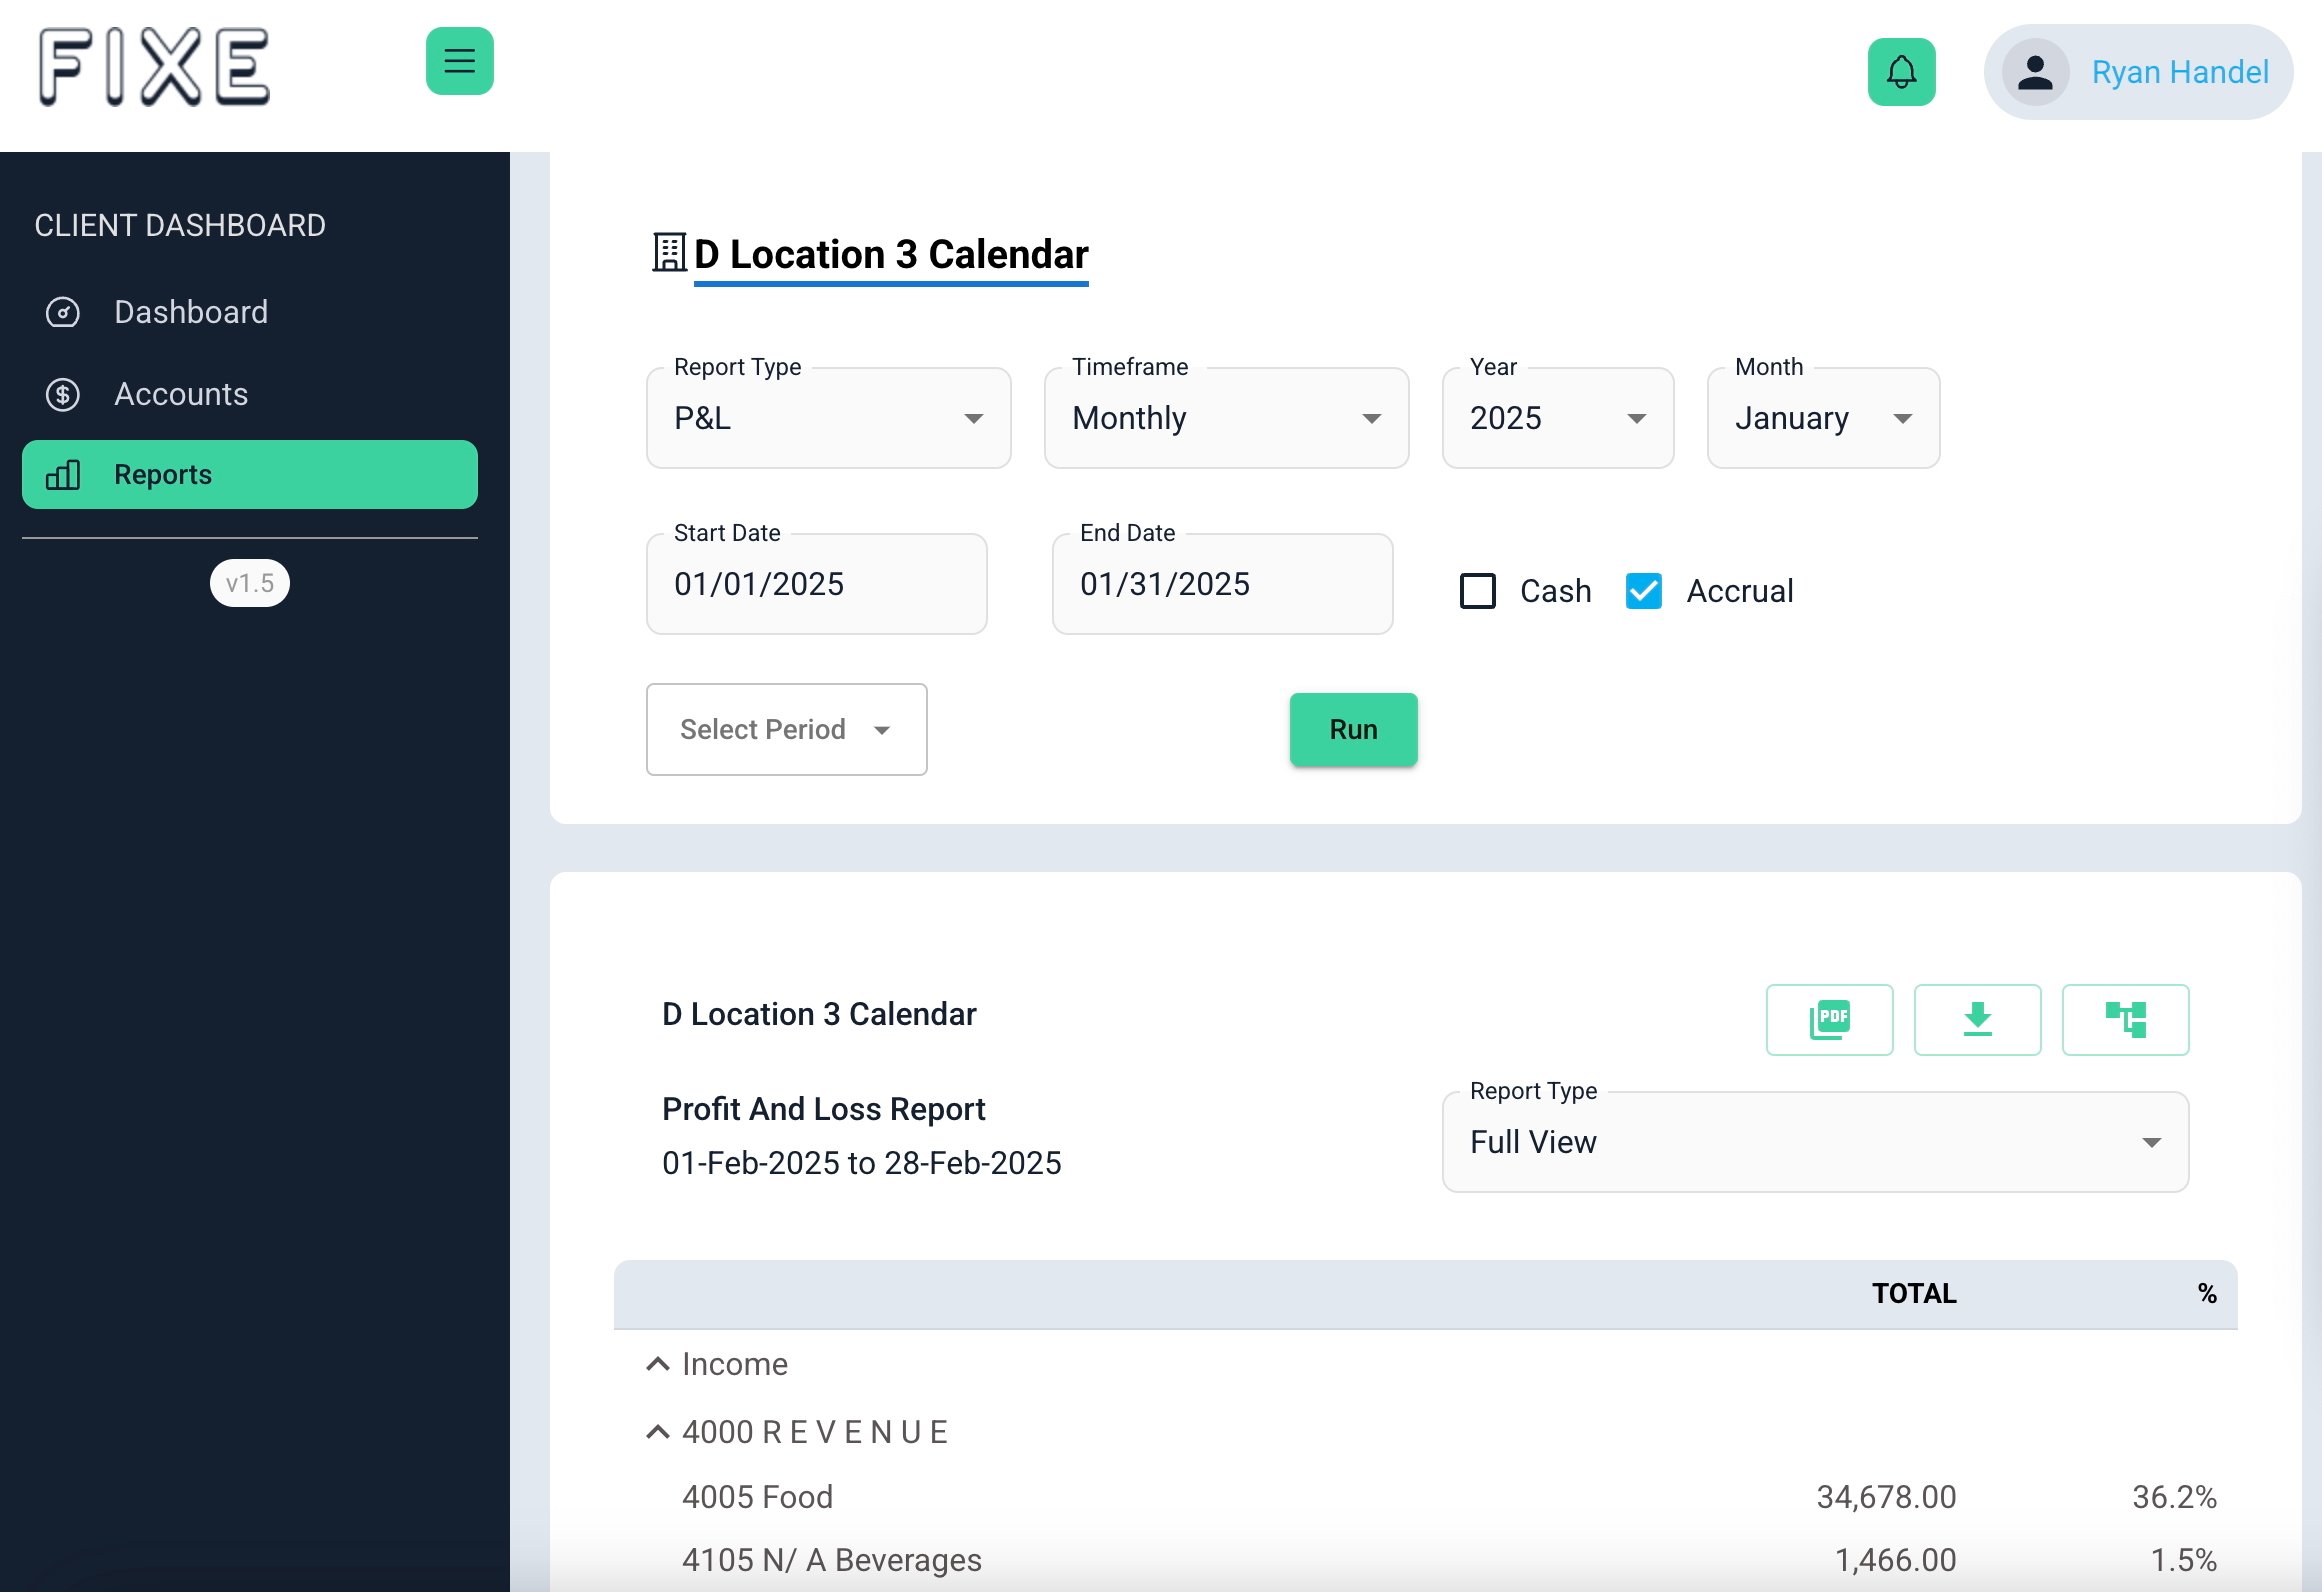
What the P&L shows: Gross sales down $14,000, from $196,400 to $182,400. A 7.1% dip reads like a slow month.
What the review catches: Operating income fell from $22,350 (an 11.9% margin) to $4,440 (a 2.5% margin), down $17,910. Net revenue fell $12,710, so profit fell further than sales. Costs rose while sales dropped.
What to do: Rebuild dinner covers without broad discounting. Threshold: gross sales of $190K+.
2. Food sales falling faster than food purchases
What the P&L shows: Food cost went from 29.0% to 30.8%. It looks like a small move.
What the review catches: Food sales fell 8.8%, but food purchases fell only 3.0%. Ordering didn't follow sales down. Protein is the biggest category at $14,900.
What to do: Review protein and produce weekly, and cost your recipes. Threshold: food cost below 29%.
3. A beverage spike that's really timing
What the P&L shows: Beverage cost jumped from 19.1% ($11,200) to 24.0% ($13,600). That looks like waste, theft or pricing.
What the review catches: A $3,400 wine order landed Sep 28. The spike is likely timing: wine bought in September and sold later.
What to do: Do a full count and confirm the wine timing before you react. Threshold: beverage cost below 22%.
4. Labor creep
What the P&L shows: Payroll went from $59,100 to $61,900. Not a huge jump on its own.
What the review catches: As a share of net revenue, payroll went from 31.4% to 35.3%, because it rose while sales fell. At a 30% target, payroll would be $52,632, a $9,268 gap.
What to do: Schedule to covers, and require manager sign-off on overtime. Threshold: payroll below 31%.
5. Prime cost over 60%
What the P&L shows: Food cost, beverage cost and payroll on separate lines. You have to add them up yourself.
What the review catches: Together, prime cost went from 58.6% to 65.1% of net revenue. Against a 60% target, September ran $8,936 over.
Try this math: prime cost = (food cost + beverage cost + payroll) / net revenue. Example: Restaurant A (sample) in September: ($38,700 + $13,600 + $61,900) / $175,440 = 65.1%. Each point = net revenue x 1% = $1,754 a month.
What to do: Look at food, beverage and labor together every week. Threshold: prime cost at or below 60%.
6. Discounts and leakage
What the P&L shows: Discounts and comps fell from $8,250 (4.2% of gross sales) to $6,960 (3.8%). Looks like progress.
What the review catches: It's still above a 3% target. At 3%, discounts would be $5,472, so September ran $1,488 over. Add $540 in refunds and chargebacks, and total leakage was $7,500.
What to do: Approve and review every discount source weekly. Threshold: discounts below 3%.
7. Cash that rose only because the owners put money in
What the P&L shows: Cash went from $41,200 to $58,300. The bank balance says you're fine.
What the review catches: Operations brought in $1,900. Financing repayments took out $9,800 ($7,300 on a revenue-based advance and $2,500 on an equipment loan). The owners added $25,000. Cash rose only because the owners put more in.
What to do: Build a 13-week cash forecast and check weekly sales against break-even. Threshold: net revenue above about $168,500. Here's how to run the break-even math.
What does a 30-day action plan look like?
Finding problems is half the job. Every Deep Dive ends with a next-month action plan: each priority gets one action and one threshold that tells you it's working. Here's the October plan from the sample review:
| Priority | Action | Threshold |
|---|
| Sales | Rebuild dinner covers without broad discounting | Gross sales $190K+ |
| Discounts | Approve and review every discount source weekly | Below 3% |
| Food | Weekly protein and produce review, recipe costing | Below 29% |
| Beverage | Full count, confirm the wine timing | Below 22% |
| Labor | Schedule to covers, manager sign-off on overtime | Below 31% |
| Prime cost | Weekly food, beverage and labor view | At or below 60% |
| Overhead | Review supplies and online orders | Under 2% |
| Cash and break-even | 13-week cash forecast, weekly sales check against break-even | Net revenue $168.5K+ |
Sample restaurant and numbers, made up for illustration.
Notice the overhead line. Supplies and online orders ran $5,100 in September, 2.9% of net revenue, and got flagged for review. Small lines add up, and a monthly review is where they get caught.
Want to know who builds these reviews? Meet Dan Margolis, FIXE's Director of Finance. And if your P&L leaves you asking what to do next, see how the Deep Dive works.
Frequently asked questions
What does a monthly Deep Dive catch that a P&L doesn't?
It connects the lines. A P&L shows food cost, payroll and cash separately. A review shows how they move together, what's timing versus a real problem, and what to do about it in the next 30 days.
What is prime cost?
Prime cost is food cost plus beverage cost plus payroll, divided by net revenue. In the sample review, it went from 58.6% to 65.1% against a 60% target.
Why did beverage cost jump if nothing changed?
It can be timing. In the sample, a $3,400 wine order landed Sep 28, which likely pushed beverage cost up. Check against a physical count before reacting.
Can cash go up when profit goes down?
Yes. In the sample, operating income fell to $4,440, but cash rose to $58,300 because the owners added $25,000. Operations brought in $1,900, and financing repayments took out $9,800.
What's in a 30-day action plan?
Each priority gets one action and one threshold that tells you it's working, like keeping discounts below 3% or prime cost at or below 60%.
Get these answers for your restaurant every month
Your books tell you what happened. The Deep Dive tells you what to do next. It's a monthly review of your numbers, built on the books FIXE closes, from people who've run restaurants. It's an extra add-on to FIXE bookkeeping. See how the Deep Dive works, then ask us about it.
More on Reading Your P&L and Reports
This post is part of our Reading Your P&L and Reports guide.
Keep reading: